List of cities in Pakistan by population

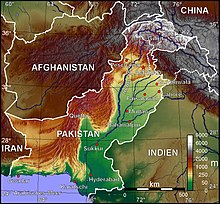
This is a list showing the 100 most populous cities in Pakistan as of the 2023 Census of Pakistan. City populations found in this list only refer to the population found within the city's defined limits and any adjacent cantonment, if exists (except for Gujranwala and Okara). The census totals below come from the Pakistan Bureau of Statistics[1] for the four provinces of Pakistan and the Islamabad Capital Territory, and from the Azad Jammu and Kashmir Planning & Development Department (PND AJK) for cities inside Azad Kashmir.[2]
As of the 2023 Census, there are two megacities, ten million-plus cities, and 100 cities having a population of 100,000 or more. Of these 100 cities, 58 are located in the country's most populous province, Punjab, 22 in Sindh, 11 in Khyber Pakhtunkhwa, six in Balochistan, two in Azad Kashmir, and one in Islamabad Capital Territory. It is unknown whether Gilgit-Baltistan has any city with over 100,000 people or not, as Gilgit-Baltistan has not yet publicly released any 2017 census results. As in the previous census in 1998, the largest city of Gilgit-Baltistan was Gilgit, with 56,701 inhabitants.
List
- Provincial capital
- Federal capital
- Divisional capital
| Rank | City | Pop. (2023 Census) |
Pop.
Growth (2017 - 2023) |
Pop. (2017 Census)[1][2] |
Pop.
Growth (1998 - 2017) |
Pop. (1998 Census) |
Pop.
Growth (1972 - 1998) |
Pop. (1972 Census) |
Province | Picture |
|---|---|---|---|---|---|---|---|---|---|---|
| 1 | Karachi | 18,868,021 | +26.49% | 14,916,456 |  | |||||
| 2 | Lahore | 13,004,135 | +16.88% | 11,126,285 |  | |||||
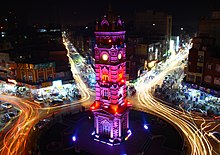
| 3 | Faisalabad | 3,691,999 | +15.20% | 3,204,726 |  | |||||
| 4 | Rawalpindi | 3,357,612 | +60.02% | 2,098,231 |  | |||||
| 5 | Gujranwala | 2,511,118 | +23.88% | 2,027,001 |  | |||||
| 6 | Multan | 2,215,381 | +18.35% | 1,871,843 |  | |||||
| 7 | Hyderabad | 1,921,275 | +10.78% | 1,734,309 |  | |||||
| 8 | Peshawar | 1,905,975 | -3.25% | 1,970,042 |  | |||||
| 9 | Quetta | 1,565,546 | +56.37% | 1,001,205 |  | |||||
| 10 | Islamabad | 1,108,872 | +9.81% | 1,009,832 | Islamabad Capital Territory |  | ||||
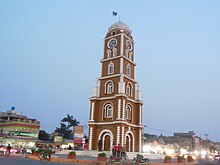
| 11 | Sargodha | 975,886 | +48.26% | 658,208 |  | |||||
| 12 | Sialkot | 911,817 | +39.03% | 655,852 |  | |||||
| 13 | Bahawalpur | 903,795 | +18.59% | 762,111 |  | |||||
| 14 | Jhang | 606,533 | +46.46% | 414,131 |  | |||||
| 15 | Sheikhupura | 591,424 | +25.00% | 473,129 |  | |||||
| 16 | Gujrat | 574,240 | +47.04% | 390,533 |  | |||||
| 17 | Sukkur | 563,851 | +12.79% | 499,900 | ||||||
| 18 | Larkana | 551,716 | +12.48% | 490,508 | ||||||
| 19 | Sahiwal | 538,344 | +38.18% | 389,605 | ||||||
| 20 | Okara | 533,693 | +49.10% | 357,935 | ||||||
| 21 | Rahim Yar Khan | 519,261 | +8.84% | 477,100 | ||||||
| 22 | Kasur | 510,875 | +42.54% | 358,409 | ||||||
| 23 | Dera Ghazi Khan | 494,464 | +23.91% | 399,064 | ||||||
| 24 | Wah Cantonment | 400,733 | +5.43% | 380,103 | ||||||
| 25 | Mardan | 368,302 | +2.70% | 358,604 | ||||||
| 26 | Nawabshah | 363,138 | +30.00% | 279,338 | ||||||
| 27 | Burewala | 361,664 | +55.73% | 231,797 | +52.40% | 152,097 | ||||
| 28 | Mingora | 361,112 | +9.07% | 331,091 | ||||||
| 29 | Hafizabad | 318,621 | +29.63% | 245,784 | ||||||
| 30 | Chiniot | 318,165 | +14.14% | 278,747 | ||||||
| 31 | Jhelum | 312,426 | +63.89% | 190,425 | +29.20% | 147,392 | ||||
| 32 | Kāmoke | 292,023 | +16.92% | 249,767 | ||||||
| 33 | Khanewal | 281,890 | +24.22% | 227,059 | +69.46% | 133,986 | ||||
| 34 | Sadiqabad | 274,210 | +13.86% | 239,677 | +65.99% | 144,391 | ||||
| 35 | Turbat | 268,625 | +24.79% | 213,557 | +211.29% | 68,603 | ||||
| 36 | Mirpur Khas | 267,833 | +14.48% | 233,916 | +23.33% | 189,671 | ||||
| 37 | Muridke | 254,291 | +34.60% | 166,652 | +48.86% | 111,951 | ||||
| 38 | Khanpur | 247,170 | +30.49% | 184,793 | +53.51% | 120,382 | ||||
| 39 | Bahawalnagar | 241,873 | +39.84% | 161,033 | +44.67% | 111,313 | ||||
| 40 | Kohat | 235,880 | +3.02% | 228,779 | +80.67% | 126,627 | ||||
| 41 | Muzaffargarh | 235,541 | +12.35% | 209,604 | +69.85% | 123,404 | ||||
| 42 | Abbottabad | 234,395 | +12.39% | 208,491 | +96.50% | 106,101 | ||||
| 43 | Mandi Bahauddin | 232,361 | +17.49% | 198,609 | +99.62% | 99,496 | ||||
| 44 | Daska | 228,626 | +23.39% | 175,170 | +70.26% | 102,883 | ||||
| 45 | Pakpattan | 221,280 | +25.30% | 176,693 | +62.05% | 109,033 | ||||
| 46 | Dera Ismail Khan | 220,575 | +1.42% | 217,457 | +136.07% | 92,114 | ||||
| 47 | Jacobabad | 219,315 | +14.81% | 191,076 | +37.68% | 138,780 | ||||
| 48 | Chakwal | 218,356 | +41.56% | 138,146 | +71.59% | 80,508 | ||||
| 49 | Khuzdar | 218,112 | +19.28% | 182,927 | +100.89% | 91,057 | ||||
| 50 | Gojra | 214,349 | +22.78% | 174,860 | +48.32% | 117,892 | ||||
| 51 | Vehari | 210,288 | +31.75% | 145,464 | +54.19% | 94,343 | ||||
| 52 | Shikarpur | 204,938 | +4.88% | 195,437 | +44.89% | 134,883 | ||||
| 53 | Ahmedpur East | 196,618 | +32.25% | 133,369 | +38.33% | 96,415 | ||||
| 54 | Hub | 195,661 | +11.57% | 175,376 | +179.43% | 62,763 | ||||
| 55 | Chishtian | 192,403 | +28.21% | 149,939 | +46.59% | 102,287 | ||||
| 56 | Khairpur | 191,044 | +4.19% | 183,181 | +73.41% | 105,637 | ||||
| 57 | Dadu | 188,317 | +10.02% | 171,191 | +66.93% | 102,550 | ||||
| 58 | Samundri | 186,371 | +16.81% | 156,991 | +185.92% | 54,908 | ||||
| 59 | Ferozwala | 177,238 | +20.38% | 141,405 | +155.09% | 55,433 | ||||
| 60 | Attock | 176,544 | +20.64% | 146,396 | +109.95% | 69,729 | ||||
| 61 | Tando Adam | 174,291 | +14.56% | 152,617 | +45.48% | 104,907 | ||||
| 62 | Tando Allahyar | 171,185 | +9.36% | 156,562 | +82.45% | 85,812 | ||||
| 63 | Jaranwala | 170,872 | +12.02% | 150,380 | +40.56% | 106,985 | ||||
| 64 | Muzaffarabad | 149,913 | +75.41% | 85,462 | ||||||
| 65 | Kamalia | 166,617 | +22.84% | 135,641 | +39.37% | 97,324 | ||||
| 66 | Kot Abdul Malik | 162,030 | +12.93% | 143,434 | +125.79% | 63,525 | ||||
| 67 | Hasilpur | 168,146 | +45.28% | 115,536 | +62.05% | 71,295 | ||||
| 68 | Arif Wala | 157,063 | +39.33% | 111,403 | +50.19% | 74,174 | ||||
| 69 | Gujranwala Cantonment | 156,929 | +14.27% | 137,302 | +47.49% | 93,093 | ||||
| 70 | Swabi | 156,496 | +21.26% | 123,412 | +53.96% | 80,157 | ||||
| 71 | Jatoi | 155,196 | +41.86% | 109,424 | +180.68% | 38,986 | ||||
| 72 | Wazirabad | 152,624 | +19.33% | 128,060 | +41.98% | 90,197 | ||||
| 73 | Layyah | 151,274 | +16.57% | 126,361 | +74.73% | 72,319 | ||||
| 74 | Haroonabad | 149,679 | +38.23% | 107,858 | +71.54% | 62,878 | ||||
| 75 | Jalalpur Jattan | 146,743 | 52.5% | 96,210 | ||||||
| 76 | Umerkot | 144,558 | +7.88% | 134,052 | +276.98% | 35,559 | ||||
| 77 | Lodhran | 144,512 | +22.26% | 117,851 | +79.92% | 65,501 | ||||
| 78 | Kot Addu | 142,161 | +9.69% | 129,703 | +60.68% | 80,720 | ||||
| 79 | Khushab | 139,905 | +17.56% | 119,384 | +35.88% | 87,859 | ||||
| 80 | Mansehra | 137,278 | +7.57% | 127,623 | +157.65% | 49,534 | ||||
| 81 | Taxila | 136,900 | +12.85% | 121,952 | +69.66% | 71,882 | ||||
| 82 | Mirpur | 124,352 | +7.53% | 115,641 | ||||||
| 83 | Kabal | 132,549 | +12.93% | 118,103 | +55.62% | 75,891 | ||||
| 84 | Bhakkar | 131,658 | +16.16% | 113,018 | +64.04% | 68,896 | ||||
| 85 | Narowal | 130,692 | +21.83% | 103,067 | +80.65% | 57,052 | ||||
| 86 | Chaman | 130,139 | +5.34% | 123,191 | +116.92% | 56,792 | ||||
| 87 | Mianwali | 129,500 | +0.85% | 118,883 | +48.29% | 80,171 | ||||
| 88 | Nowshera | 122,953 | +2.36% | 120,131 | +33.76% | 89,813 | ||||
| 89 | Lala Musa | 121,036 | +32.1% | 91,566 | ||||||
| 90 | Shahdadkot | 120,687 | +1.04% | 118,915 | +96.76% | 60,436 | ||||
| 91 | Charsadda | 120,170 | +5.02% | 114,565 | +31.35% | 87,218 | ||||
| 92 | Ghotki | 119,879 | +7.68% | 111,321 | +110.74% | 52,823 | ||||
| 93 | Sambrial | 119,571 | +9.17% | 109,479 | +120.84% | 49,574 | ||||
| 94 | Bhalwal | 117,982 | +17.68% | 100,135 | +62.76% | 61,523 | ||||
| 95 | Badin | 117,455 | +3.45% | 112,420 | +78.89% | 62,843 | ||||
| 96 | Phoolnagar | 114,530 | 23.3% | 92,842 | ||||||
| 97 | Tando Muhammad Khan | 114,406 | +12.96% | 101,863 | +55.76% | 65,396 | ||||
| 98 | Kamber Ali Khan | 112,313 | +10.68% | 101,474 | +73.85% | 58,369 | ||||
| 99 | Kotri | 106,615 | +5.27% | 101,124 | -61.01% | 259,358 | ||||
| 100 | Kandhkot | 99,155 | +1.00% | 100,698 | +49.04% | 67,566 | ||||
| 101 | Kunjah | 90,905 | +178.7% | 32,588 | ||||||
| 102 | Daharki | 90,177 | +4.55% | 86,286 | +149.3% | 34,615 | ||||
| 103 | Mirpur Mathelo | 74,651 | -0.82% | 75,270 | +77.4% | 42,421 |
See also
References
- ^ a b "Block Wise Provisional Summary Results of 6th Population & Housing Census-2017 [As on January 03, 2018]". Block Wise Provisional Summary Results of 6th Population & Housing Census-2017 [As on January 03, 2018]. Pakistan Bureau of Statistics. Retrieved 4 May 2020.
- ^ a b "Statistical Year Book 2019" (PDF). Planning & Development Department. Azad Government of the State of Jammu & Kashmir. 20 February 2020. Archived (PDF) from the original on 30 June 2020. Retrieved 30 June 2020.
- ^ "URBAN LOCALITIES BY POPULATION SIZE AND THEIR POPULATION BY SEX, ANNUAL GROWTH RATE AND HOUSEHOLD SIZE : CENSUS-2023" (PDF).
- ^ "URBAN LOCALITIES BY POPULATION SIZE AND THEIR POPULATION BY SEX, ANNUAL GROWTH RATE AND HOUSEHOLD SIZE : CENSUS-2023" (PDF).
- ^ "URBAN LOCALITIES BY POPULATION SIZE AND THEIR POPULATION BY SEX, ANNUAL GROWTH RATE AND HOUSEHOLD SIZE : CENSUS-2023" (PDF).
- ^ "URBAN LOCALITIES BY POPULATION SIZE AND THEIR POPULATION BY SEX, ANNUAL GROWTH RATE AND HOUSEHOLD SIZE : CENSUS-2023" (PDF).
